Dashboard
The Dashboard is the home screen of M7 Hardware Dash. It gives an instant snapshot of the entire fleet — asset counts, warranty health, category breakdown, and recent purchase activity.
Navigate to Dashboard in the top navigation bar (or go to the app root URL).
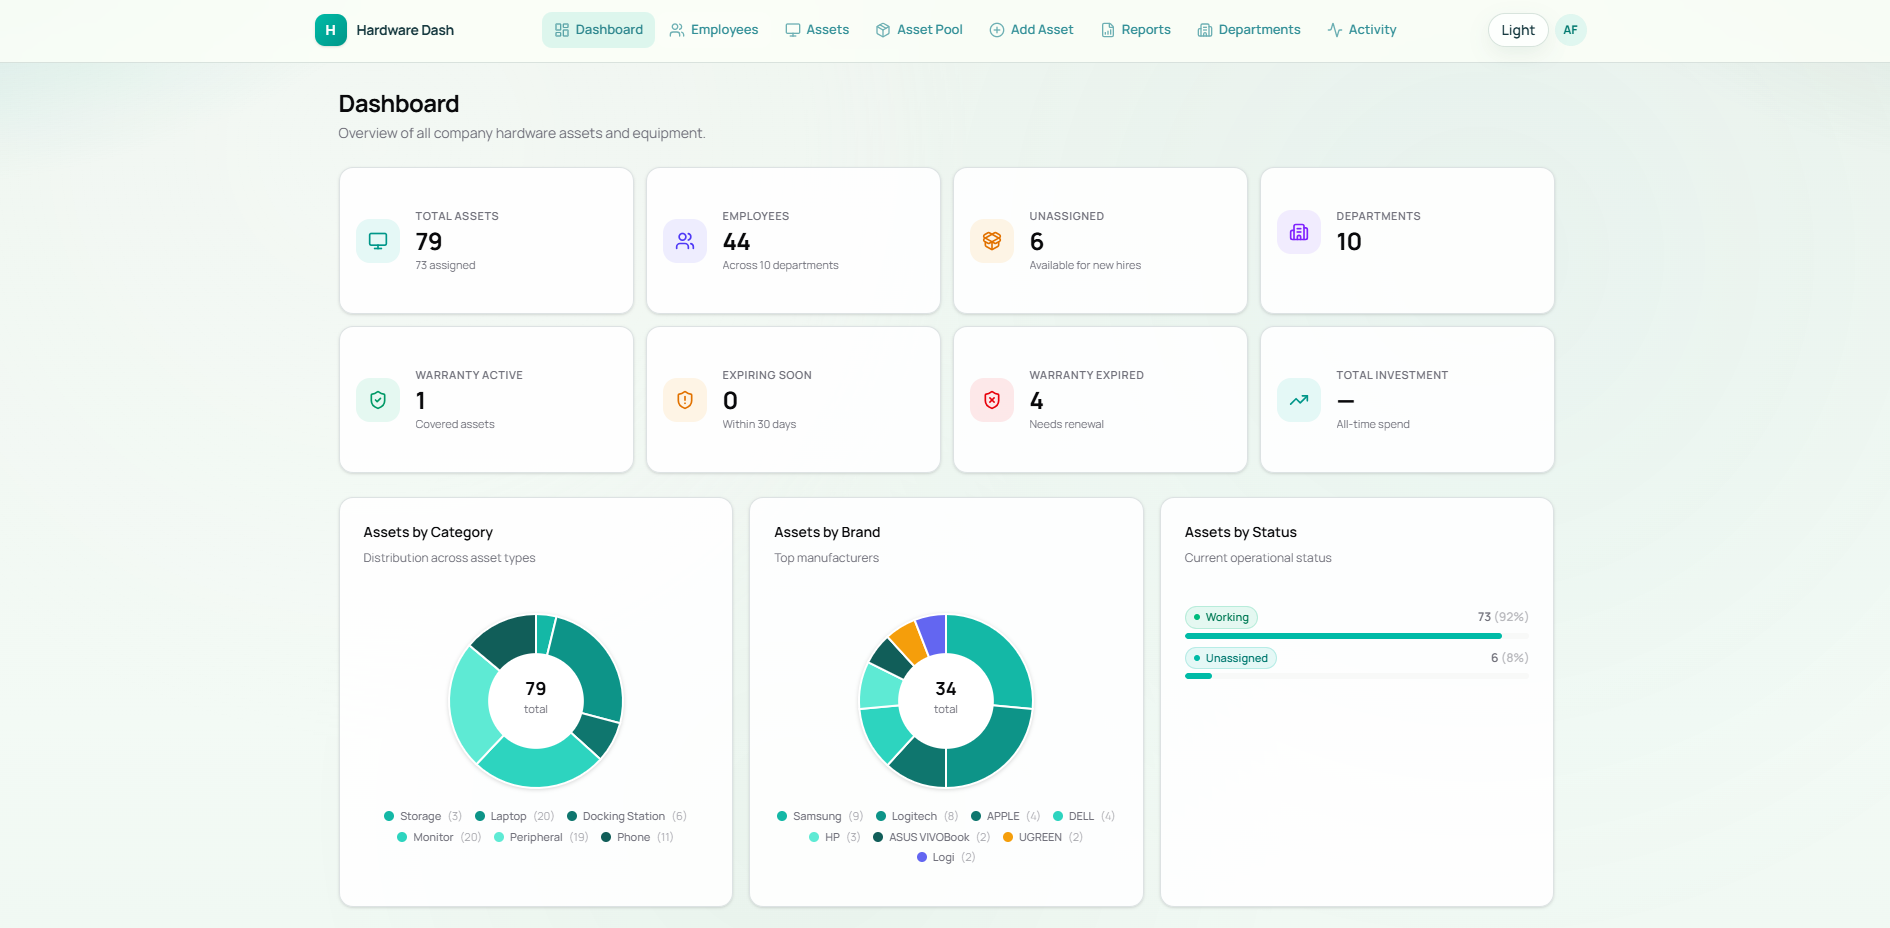
KPI Cards — Row 1
Section titled “KPI Cards — Row 1”The first row shows the core fleet metrics:
| Card | Current Value | Description |
|---|---|---|
| Total Assets | 79 (73 assigned) | All hardware in the registry |
| Employees | 44 (Across 10 departments) | All staff in the directory |
| Unassigned | 6 (Available for new hires) | Assets in the pool with no employee |
| Departments | 10 | Active departments in the system |
KPI Cards — Row 2
Section titled “KPI Cards — Row 2”The second row covers warranty and financial health:
| Card | Current Value | Description |
|---|---|---|
| Warranty Active | 1 | Assets with a valid warranty on record |
| Expiring Soon | 0 | Assets whose warranty expires within 30 days |
| Warranty Expired | 4 | Assets needing warranty renewal — action required |
| Total Investment | — | All-time hardware spend (THB) — shows — until purchase costs are entered |
Action required: 4 assets have expired warranties. Go to Reports → Warranty for the full list.
Charts
Section titled “Charts”Three visualisation panels sit below the KPI cards:
Assets by Category
Section titled “Assets by Category”Donut chart showing the distribution of all 79 assets across hardware types.
| Category | Count |
|---|---|
| Laptop | 20 |
| Monitor | 20 |
| Peripheral | 19 |
| Phone | 11 |
| Docking Station | 6 |
| Storage | 3 |
Assets by Brand
Section titled “Assets by Brand”Donut chart showing the top manufacturers in the fleet (34 distinct brand entries):
| Brand | Count |
|---|---|
| Samsung | 9 |
| Logitech | 8 |
| Apple | 4 |
| Dell | 4 |
| HP | 3 |
| ASUS VIVOBook | 2 |
| UGREEN | 2 |
| Logi | 2 |
Assets by Status
Section titled “Assets by Status”Horizontal bar showing operational health:
| Status | Count | Percentage |
|---|---|---|
| Working | 73 | 92% |
| Unassigned | 6 | 8% |
Recent Purchases
Section titled “Recent Purchases”A scrollable table of the most recently added assets, showing:
| Column | Description |
|---|---|
| Asset | Asset name and ID |
| Assigned To | Employee name (clickable) or Unassigned |
| Date | Purchase / registration date |
| Cost | THB cost, or — |
Click View all → to go to the full Assets table.
Warranty Alerts
Section titled “Warranty Alerts”A panel on the right showing all assets with expired or expiring warranties (within 90 days):
| Column | Description |
|---|---|
| Asset | Asset name and ID |
| Status | Expired (red badge) |
| Expiry | Warranty end date |
| Assigned To | Employee (or — if unassigned) |
Click Full report → to go to Reports → Warranty for more detail and CSV export.
Dashboard Layout
Section titled “Dashboard Layout”graph TD A[Dashboard] --> B[Row 1 KPIs\nAssets · Employees · Unassigned · Departments] A --> C[Row 2 KPIs\nWarranty Active · Expiring · Expired · Investment] A --> D[Charts Row\nBy Category · By Brand · By Status] A --> E[Recent Purchases Table] A --> F[Warranty Alerts Panel] E -->|View all| G[Assets Page] F -->|Full report| H[Reports → Warranty Tab]