Dashboard
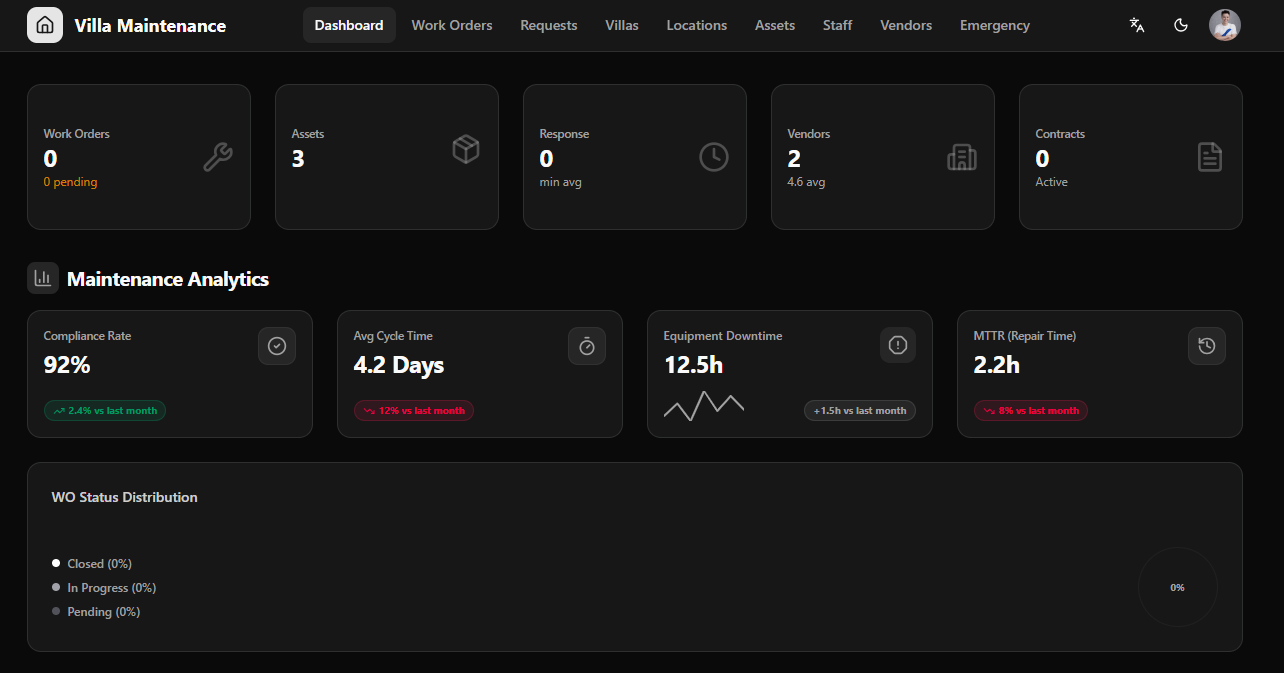
The M2 Dashboard is the home screen of the maintenance management system. It provides a real-time operational overview of all villa properties — active work orders, asset health, vendor performance, and location status — in a single dark-themed interface.
Layout Overview
Section titled “Layout Overview”┌────────────────────────────────────────────────────────┐│ Sidebar │ KPI Cards Row ││ │────────────────────────────────────────────││ │ Maintenance Analytics │ WO Distribution ││ │────────────────────────────────────────────││ │ Villa Status Map ││ │────────────────────────────────────────────││ │ Recent Actions (tabbed) │└────────────────────────────────────────────────────────┘KPI Cards
Section titled “KPI Cards”Five summary cards run across the top of the dashboard.
| Card | Value Shown | Sub-detail |
|---|---|---|
| Work Orders | Total open WOs | pending X count |
| Assets | Total tracked assets | — |
| Response | Average response time (minutes) | — |
| Vendors | Total active vendors | Average rating (e.g. 4.6 ★) |
| Contracts | Active service contracts | — |
KPI values reflect live data across all villas. Zero values indicate no active records for that metric.
Maintenance Analytics
Section titled “Maintenance Analytics”Four performance indicators displayed as metric tiles with trend arrows:
| Metric | Description | Trend Indicator |
|---|---|---|
| Compliance Rate | % of scheduled maintenance completed on time | ↑ green = improving |
| Avg Cycle Time | Average days to close a work order | ↓ green = faster resolution |
| Equipment Downtime | Total hours equipment was out of service | ↑ red = worsening |
| MTTR | Mean Time To Repair (hours) | ↓ green = faster repairs |
Each tile shows the current value and a percentage change indicator compared to the previous period:
- Green arrow up — metric is improving
- Red arrow up — metric is worsening (e.g. more downtime)
- Green arrow down — metric is improving (e.g. faster cycle time)
WO Status Distribution
Section titled “WO Status Distribution”A donut or bar chart showing the breakdown of all work orders by current status:
| Status | Color |
|---|---|
| Closed | Blue |
| In Progress | Amber |
| Pending | Gray |
When no work orders exist, all segments show 0%.
Villa Status Map
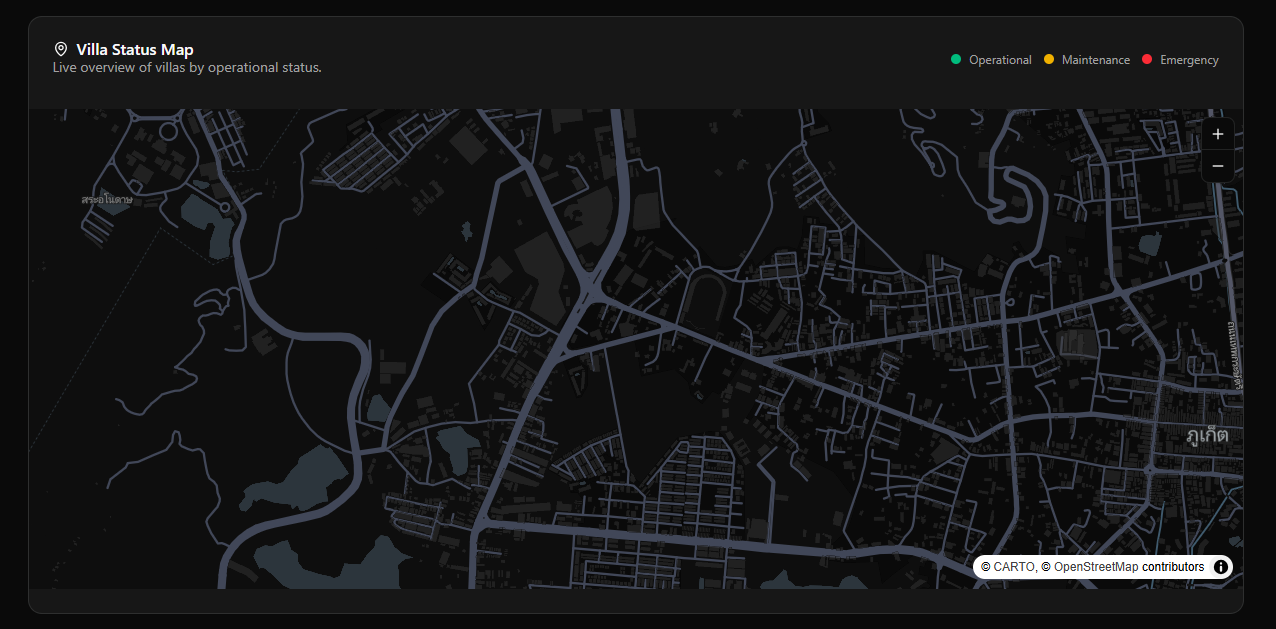
Section titled “Villa Status Map”An interactive map covering the managed villa portfolio — centered on the operating region (e.g. Phuket).
Map Provider
Section titled “Map Provider”The villa status map uses CARTO tiles rendered over OpenStreetMap data.
Map Legend
Section titled “Map Legend”| Marker Color | Villa Status |
|---|---|
| Green | Operational — no active issues |
| Orange | Maintenance — work in progress |
| Red | Emergency — critical issue active |
Click any villa marker to see its name and current status. The map updates in real time as work order statuses change.
Recent Actions
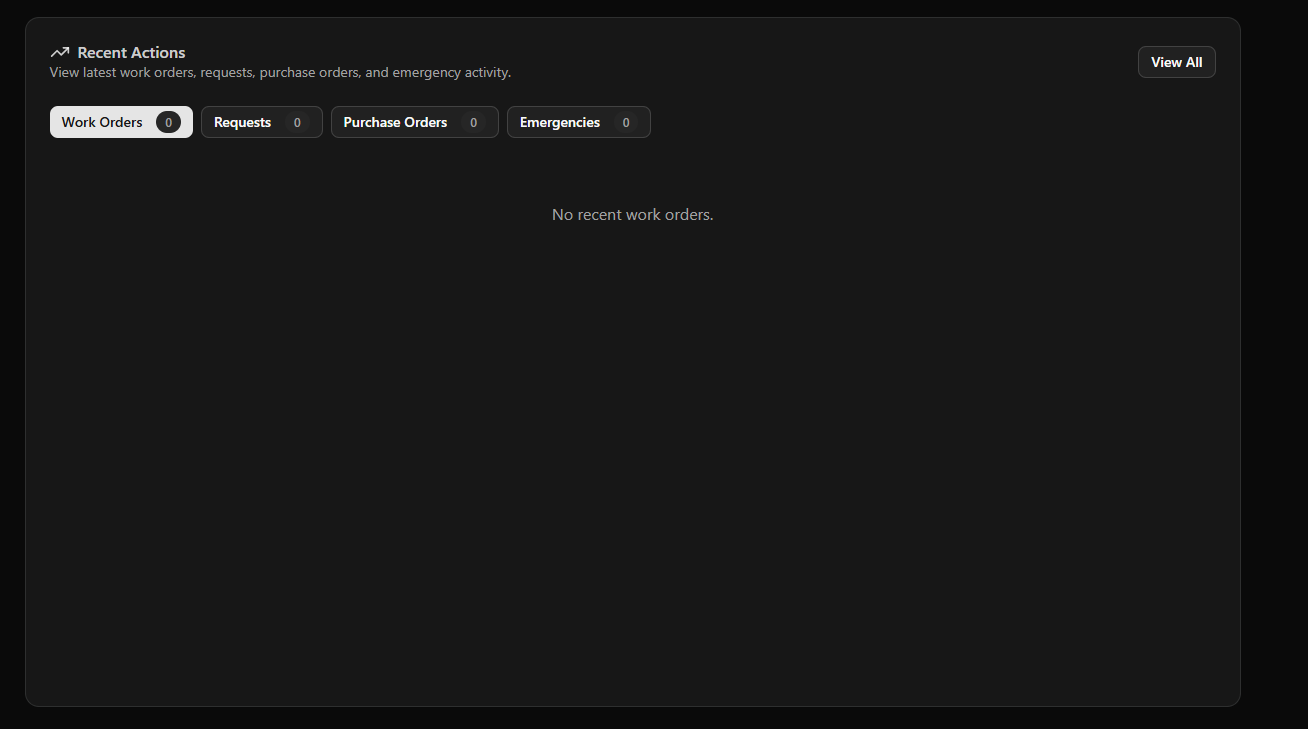
Section titled “Recent Actions”A tabbed panel at the bottom of the dashboard showing the latest activity across key modules.
| Tab | Shows |
|---|---|
| Work Orders | Most recently created or updated work orders |
| Requests | Latest maintenance requests submitted |
| Purchase Orders | Recent purchase order activity |
| Emergencies | Active or recently resolved emergency incidents |
Each row shows the record identifier, title, status badge, and timestamp. Empty tabs indicate no recent records in that category.
Navigation Sidebar
Section titled “Navigation Sidebar”The left sidebar provides access to all M2 modules:
| Section | Module |
|---|---|
| Dashboard | Home screen (this page) |
| Work Orders | Maintenance ticket management |
| Requests | Inbound maintenance requests |
| Villas | Villa property records and map |
| Locations | Location and zone management |
| Assets | Equipment and asset registry |
| Staff | Staff directory and teams |
| Vendors | Vendor directory and contracts |
| Emergency | Emergency response management |
| PMP | Preventive maintenance schedules |
| Inventory | Parts and stock management |
| Purchase Orders | PO creation and tracking |
| Reports | Analytics and reporting |
| Settings | System configuration |