Dashboard
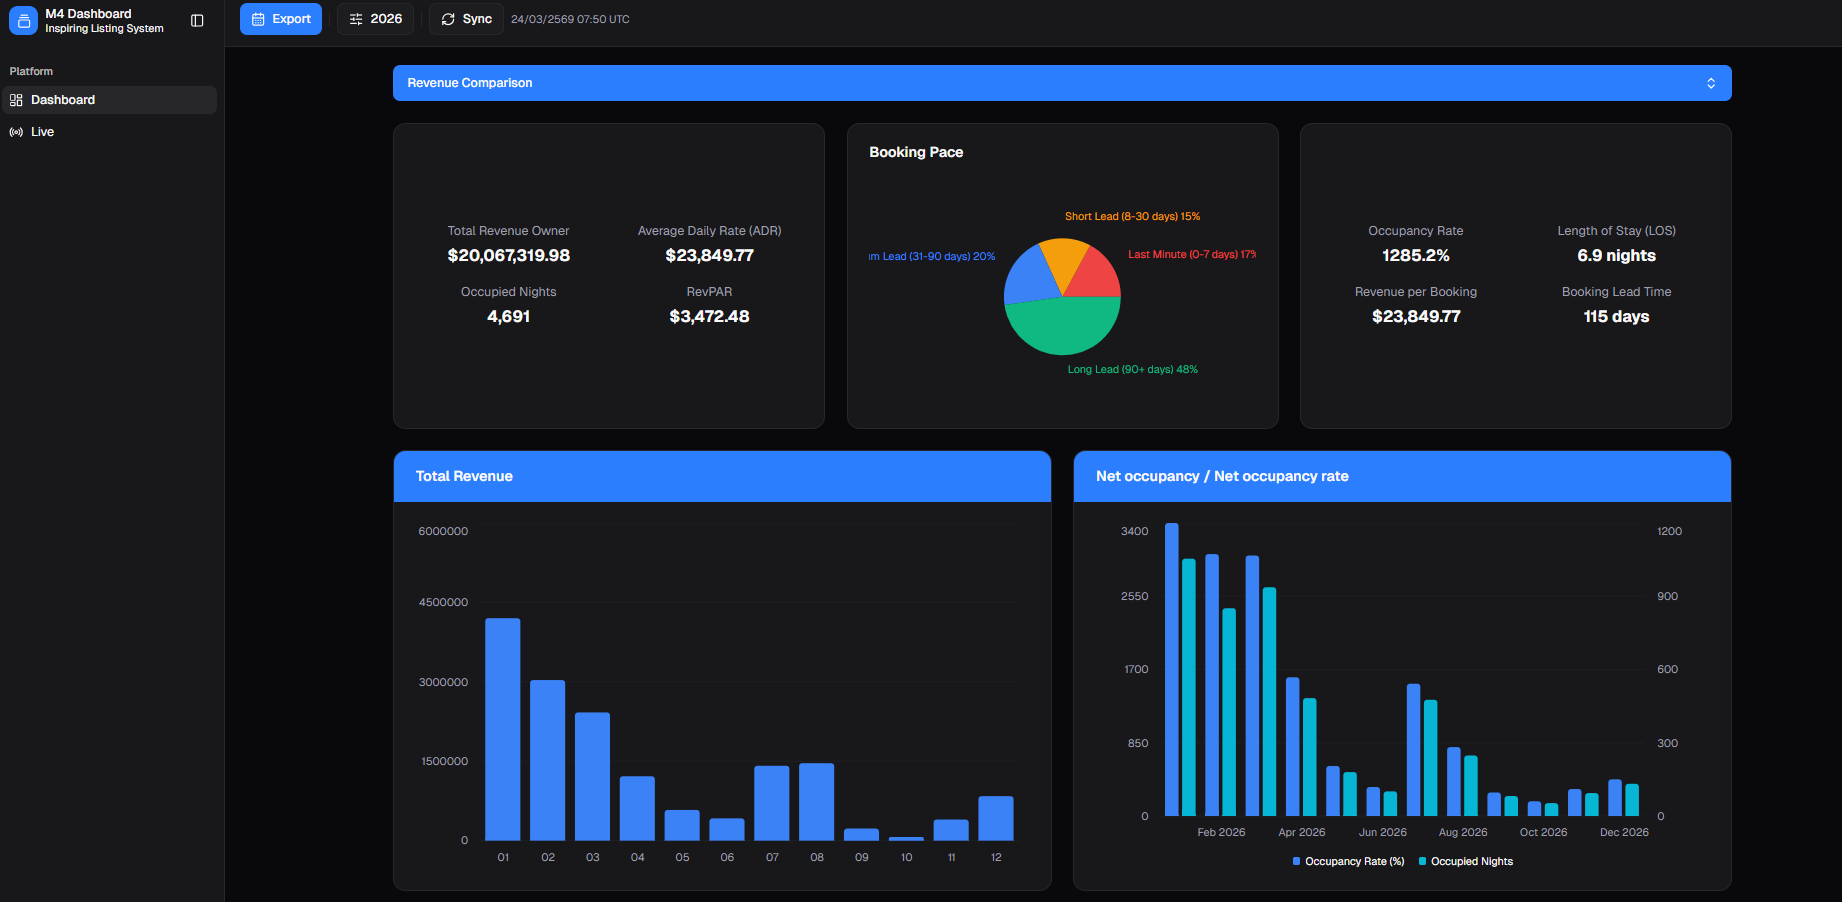
The Dashboard is the primary analytics view of M4. It shows aggregated data from Hostify, with a Revenue Comparison selector, filter controls, and export functionality.
Key differences from the Live view:
| Feature | Dashboard | Live |
|---|---|---|
| Top button | Sync | Refresh |
| Content header | Revenue Comparison selector | Live API indicator |
| Channel Mix | Full channel breakdown with % | Partial view |
| Filters | Listing / Date based on / View by / Year | Year only |
| Export | Date range picker with calendar | Export button |
Top Bar Controls
Section titled “Top Bar Controls”| Control | Description |
|---|---|
| Export | Opens a dual-month date range picker to select the export period |
| Year selector | Filters all charts and KPIs by year (e.g. 2026) |
| Sync | Syncs the aggregated dashboard data from Hostify |
| Timestamp | Last sync time in UTC (Thai Buddhist Era format, e.g. 24/03/2569) |
Revenue Comparison Selector
Section titled “Revenue Comparison Selector”A blue dropdown header at the top of the content area labelled Revenue Comparison. Allows switching the primary metric being compared across charts.
Filter Panel
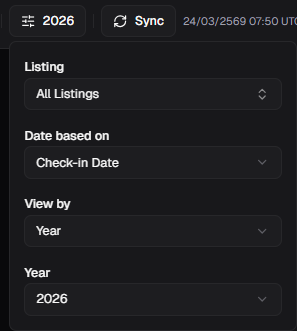
Section titled “Filter Panel”Clicking the year/filter controls opens a filter panel with:
| Filter | Default | Options |
|---|---|---|
| Listing | All Listings | Individual villa listings |
| Date based on | Check-in Date | Check-in Date / Booking Date / etc. |
| View by | Year | Year / Month / Quarter |
| Year | 2026 | Available years |
Revenue & Performance KPIs
Section titled “Revenue & Performance KPIs”Same four headline metrics as the Live view, sourced from aggregated Hostify data:
| Metric | Value |
|---|---|
| Total Revenue Owner | $20,067,319.98 |
| Average Daily Rate (ADR) | $23,849.77 |
| Occupied Nights | 4,691 |
| RevPAR | $3,472.48 |
Note: Total Revenue Owner may differ slightly from the Live view due to sync timing.
Booking Pace
Section titled “Booking Pace”Pie chart — identical to Live view:
| Segment | % | Colour |
|---|---|---|
| Long Lead (90+ days) | 48% | Green |
| Mid Lead (31–90 days) | 20% | Blue |
| Short Lead (8–30 days) | 15% | Yellow |
| Last Minute (0–7 days) | 17% | Red |
Occupancy & Stay Metrics
Section titled “Occupancy & Stay Metrics”| Metric | Value |
|---|---|
| Occupancy Rate | 1285.2% |
| Length of Stay (LOS) | 6.9 nights |
| Revenue per Booking | $23,849.77 |
| Booking Lead Time | 115 days |
Charts
Section titled “Charts”Total Revenue
Section titled “Total Revenue”Monthly bar chart (Jan–Dec), USD. Peak months: Jan–Mar (up to ~4.3M), declining through mid-year with partial recovery in Jul–Aug.
Net Occupancy / Net Occupancy Rate
Section titled “Net Occupancy / Net Occupancy Rate”Dual-axis bar chart (Feb–Dec 2026):
| Series | Colour | Axis |
|---|---|---|
| Occupancy Rate (%) | Teal | Right |
| Occupied Nights | Light blue | Left |
Number of Bookings / Total Occupied Nights
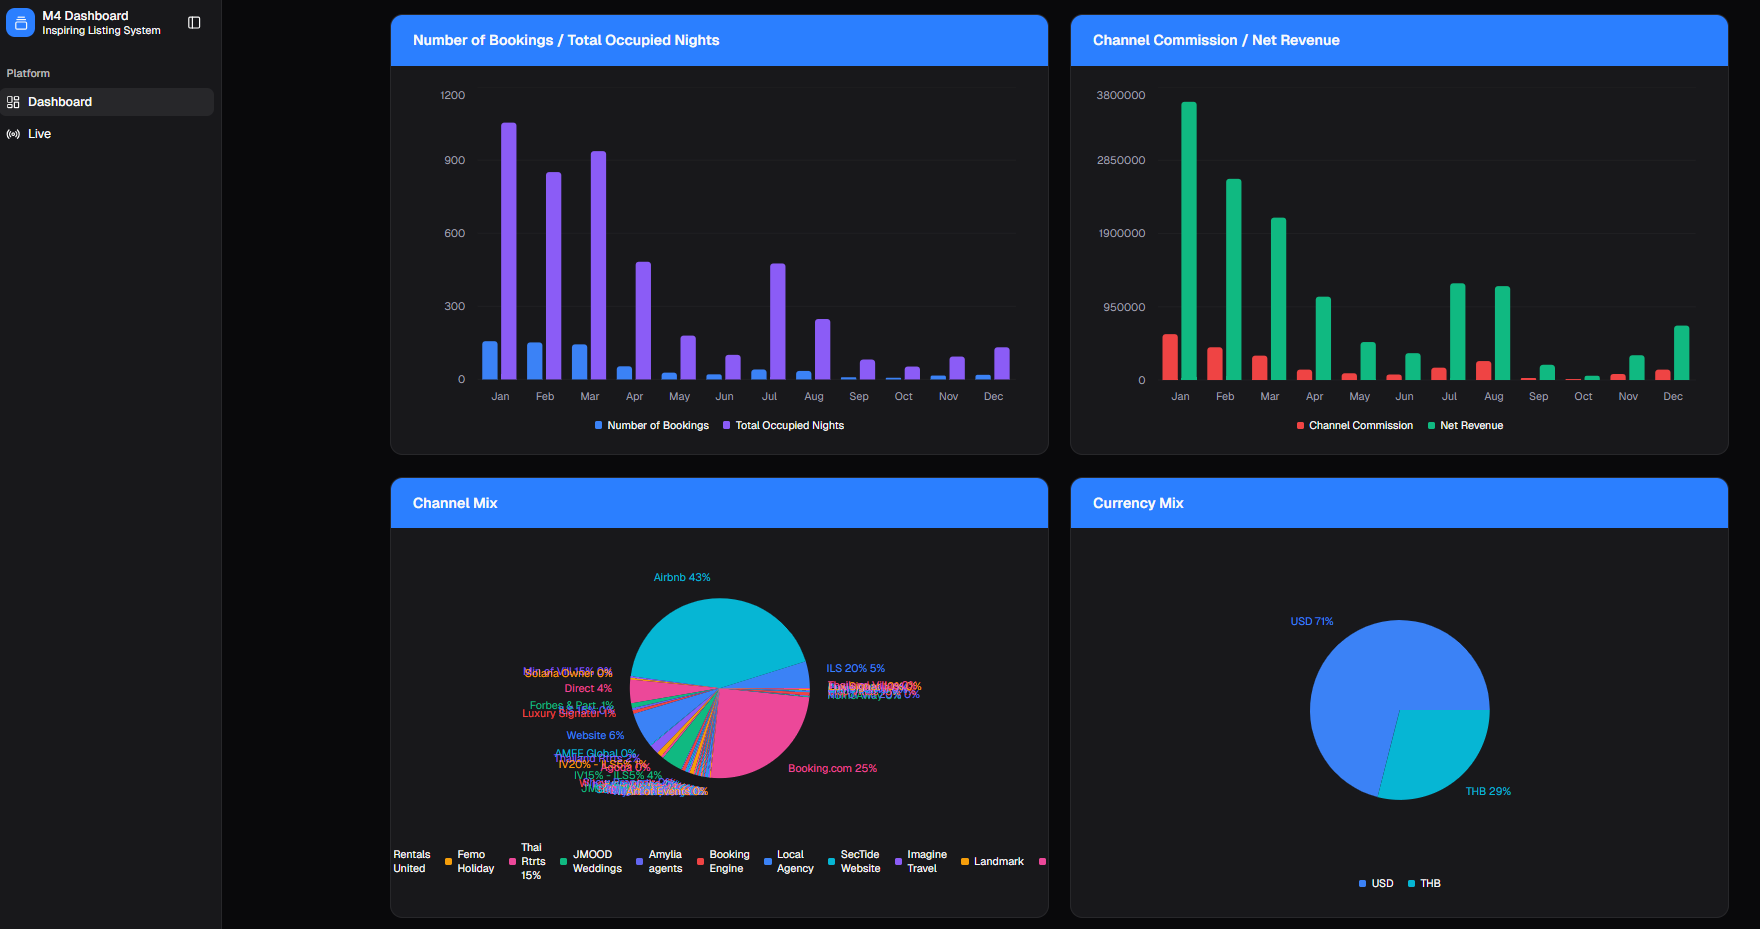
Section titled “Number of Bookings / Total Occupied Nights”Dual bar chart (Jan–Dec):
| Series | Colour |
|---|---|
| Number of Bookings | Blue |
| Total Occupied Nights | Purple |
Peak in Feb–Mar, secondary peak in Jul–Aug.
Channel Commission / Net Revenue
Section titled “Channel Commission / Net Revenue”Dual bar chart (Jan–Dec):
| Series | Colour |
|---|---|
| Channel Commission | Red |
| Net Revenue | Green |
Peak net revenue in Jan–Feb (~3.8M). Commission visible as a small red portion alongside the green net revenue bars.
Channel Mix
Section titled “Channel Mix”Full channel breakdown pie chart — more detailed than the Live view:
| Channel | Share |
|---|---|
| Airbnb | 43% |
| Booking.com | 25% |
| Thai Rtrts | 15% |
| ILS 20% | 5% |
| Website | 6% |
| Direct | 4% |
| Luxury Signatur | 4% |
| Forbes & Part. | 1% |
| Solaria Owner | 0% |
| AMEE Global | 0% |
| Others (Rentals United, Femo Holiday, JMOOD Weddings, Amylia agents, Booking Engine, Local Agency, SecTide Website, Imagine Travel, Landmark) | < 1% each |
Airbnb and Booking.com together account for 68% of all bookings.
Currency Mix
Section titled “Currency Mix”| Currency | Share |
|---|---|
| USD | 71% |
| THB | 29% |
Export — Date Range Picker
Section titled “Export — Date Range Picker”Clicking Export opens a dual-month calendar picker:
- Shows two months side by side (e.g. March 2026 and April 2026)
- Navigate months with
‹/›arrows - Select a date range by clicking start and end dates
- × Clear — resets the selection
- ↓ Export — downloads the filtered data for the selected range