Dashboard
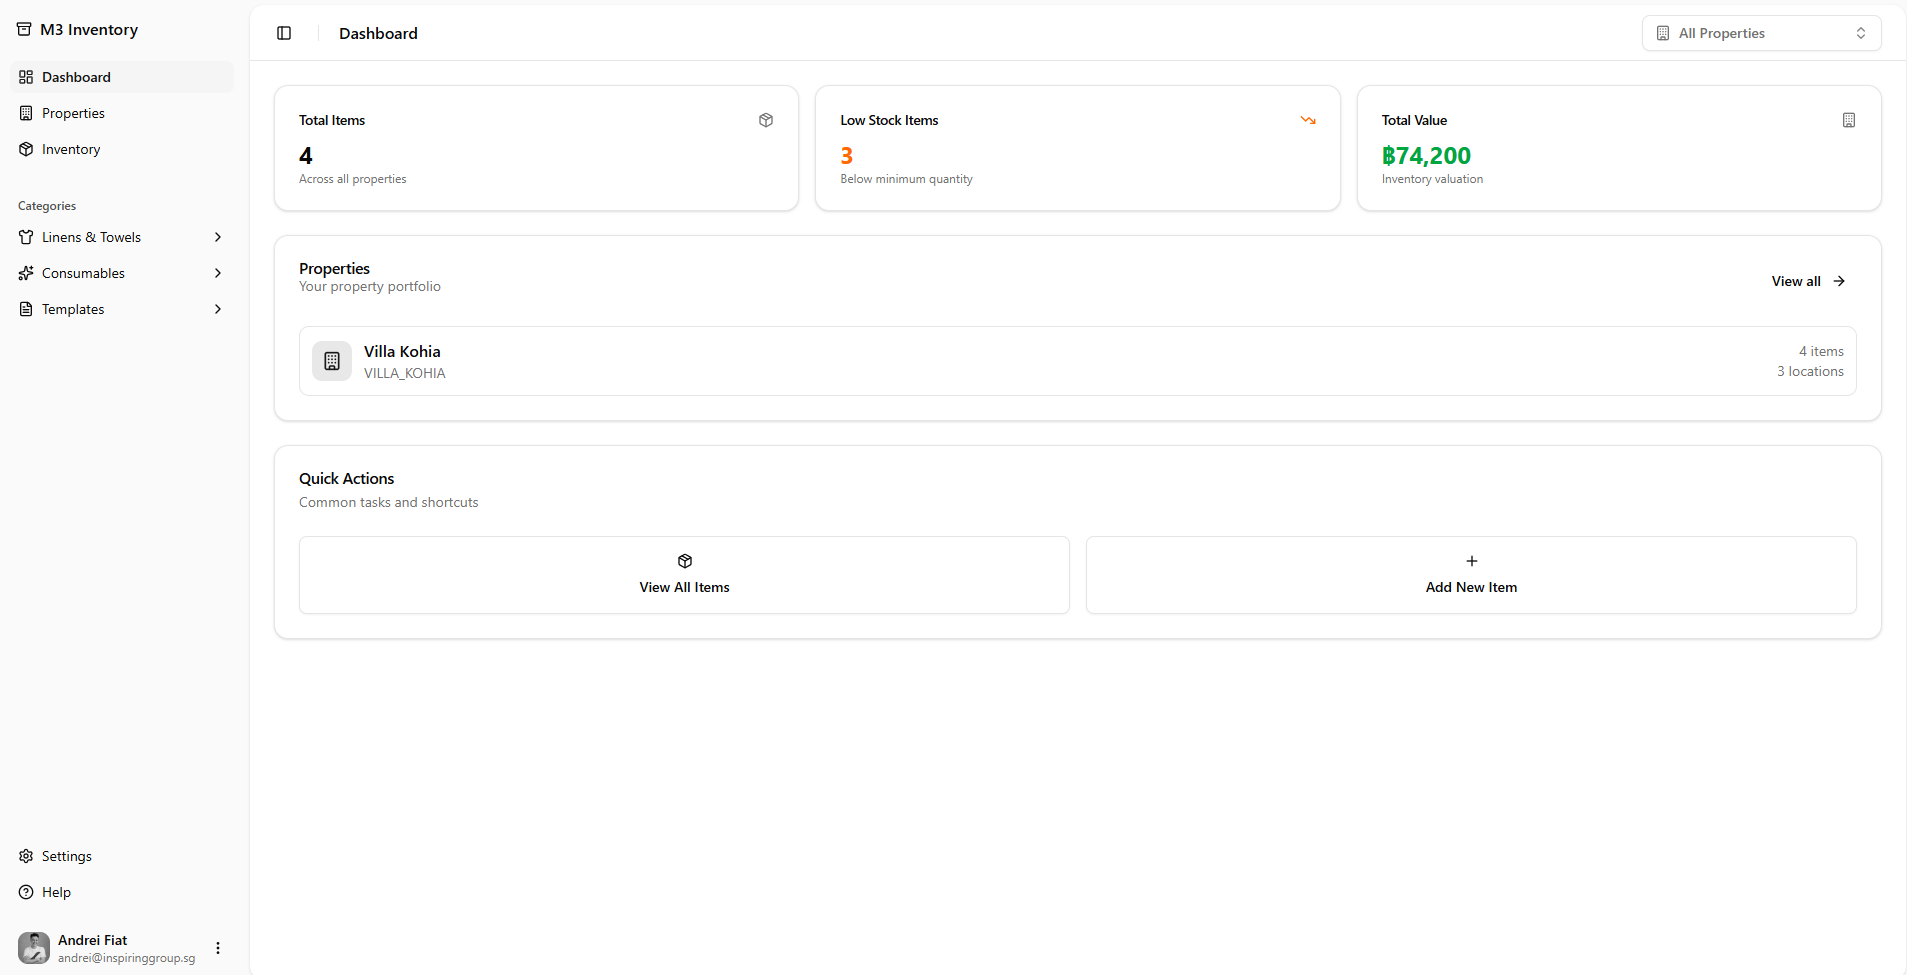
The M3 Dashboard is the home screen of the inventory system. It shows a real-time summary of stock levels, total valuation, and provides quick navigation to common tasks.
Layout
Section titled “Layout”The dashboard has three main sections: KPI cards, a Properties snapshot, and Quick Actions.
The All Properties dropdown in the top right filters all dashboard data to a specific property.
KPI Cards
Section titled “KPI Cards”| Card | Colour | Description |
|---|---|---|
| Total Items | Gray | All inventory items across all properties |
| Low Stock Items | Orange | Items currently below their minimum quantity threshold |
| Total Value | Green (฿) | Total inventory valuation (sum of quantity × unit cost) |
Example values (live data): Total Items: 4 · Low Stock: 3 · Total Value: ฿74,200
Properties
Section titled “Properties”Your property portfolio
Shows a compact list of all registered properties. Each row displays:
| Element | Description |
|---|---|
| Property icon | Building icon |
| Property Name | e.g. Villa Kohia |
| Property Code | e.g. VILLA_KOHIA |
| Item count | Total inventory items in this property |
| Location count | Number of registered locations |
View all → link navigates to the full Properties page.
Example (live data): Villa Kohia — 4 items · 3 locations
Quick Actions
Section titled “Quick Actions”Common tasks and shortcuts
| Action | Description |
|---|---|
| View All Items | Navigates to the full Inventory list |
| Add New Item | Opens the Add Item form |